|

|
In this science nugget, the SXT chief observers prove that they are really astronomers: we discuss a catalog of objects in the sky. It is a glorious tradition no doubt going back beyond Ptolemy. Our objects are flares, one of the most fascinating and important subjects for both satellites. The problem is that not everybody agrees that flares should represent the onlt subject of study, and their unreasonable position on this leaves us with lots of missed flares. Indeed the small TRACE field of view pretty much guarantees that we will miss a lot anyway.
So, as a means of assessing where we stand (here in the middle of the maximum of the sunspot cycle, one of us (NVN) has created a catalog of overlapping observations. This catalog will grow with time as more events occur. Other similar catalogs have been prepared by J. Khan and H. Warren, and they are really helpful in finding just the right observation to confirm your pet theory (for example)!
Here's an overview:

|

|
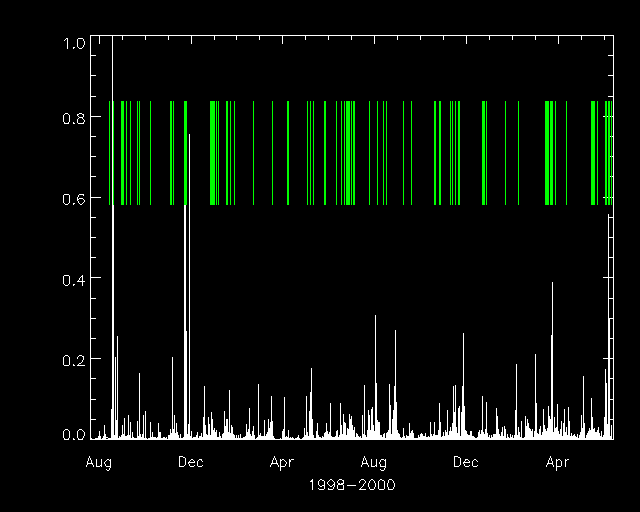
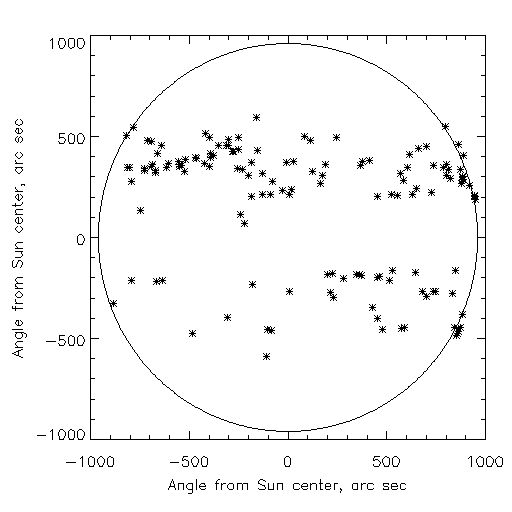
In the left plot above, the black-and-white part shows the GOES soft X-ray fluxes in arbitrary units, for the two years of the catalog (first entry on Bastille Day, July 14, 1998). The colored lines show the times of the catalog entries. The right plot shows event locations, with the curious avoidance of the limb probably resulting from historical patterns of TRACE observations. West limb more pronounced, presumably, because we're aware of hot active regions there; northern hemisphere more numerous because of unknown vagaries of the solar dynamo...
The basis of the catalog is the hard X-ray flux as inferred from a Yohkoh file directory created by M. Sawa, to whom we're grateful. This leads to a set of time and space filters to be sure that an overlap between Yohkoh and TRACE exists - that's the important part. The results (142 events) include the following totals:
| C | M | X |
| 95 | 39 | 8 |
where the discerning reader will note that the numbers don't add up (because of database gaps, nothing sinister). The GOES C, M, and X classification really expresses the peak soft X-ray flux in base-10 logarithms (-5, -4, and -3 for the chosen units). In fact the significance of these numbers is that we've beaten the odds and find disproportionately many bigger events - there should be about ten times as many M's as X's, and similarly C's than M's. Why this should be might be a small puzzle that somebody could solve.
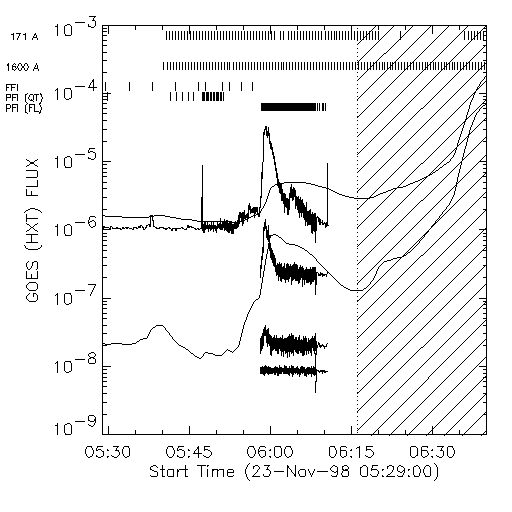
Viewing the statistics above, one might get the idea that we have plenty of flare observations. Nothing, it turns out, could be further from the truth! The example plots below (rough working plots from the NVN catalog software, not really polished) show why. The third X-class events on the list have the following synoptic time series (click on the image to enlarge):


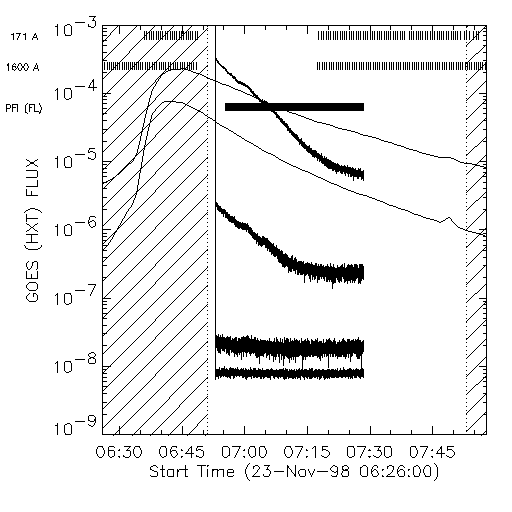
These plots are packed with information about the types of exposures used by both TRACE and Yohkoh (see the labels on the left of each plot), all neatly laid out on a background of time histories of hard (the four HXT channels) and soft X-rays (the two GOES bands; these are the smoother curves). But the basic message is clear: right in the middle of this X-class event Yohkoh chose to enter orbit night (indicated by the hatched area). On an average this should not usually happen, but it always seems to! But not really always:

Here we both got most of the peak of the event, although for Yohkoh it was preceded by SAA and followed by night. This was incidentally the X-class flare described as "a coronal problem" in a recent science nugget
We've got to keep plugging away, because (a) flares are really interesting, and (b) we don't have enough complementary data yet. We are going to try August 18-28 to get more data, we hope, in conjunction with the excellent SOHO magnetic observations. In the meanwhile, the catalog exists and can be used to find flares with interesting properties.