Lesson designed by the YPOP Team
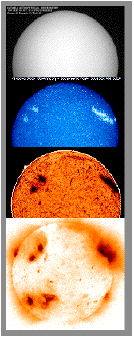
After practicing with the filter wheel we will examine various images of the Sun. Each solar image has been obtained with a different solar filter. The student will analyize the strengths and weaknesses of this data collection process.
Scientists often used different filters to help them gather information about a particular object. Often particular information is enhanced with one filter and "hidden" with another. When a scientist is interested in studying a certain aspect of an object he or she might view that object through a filter that enphasized what they are interested in and at the same time keeps the other information from becoming too distracting.
The knowledge gained in this lesson lends well to independent research projects in spectroscopy, medical imaging, or satellite imaging.
Let's get started by examining what
different filters can do.
![]()
Lesson designed by the YPOP
Team
For questions about this lesson, please contact
Michelle B. Larson
![]()
 |
|
![]()
 |
|
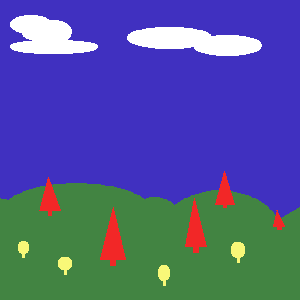
Some of the features in the image may be a color that does not contain ANY wavelength the same as our filter. All of the light from these features will be absorbed. They will become invisible to us when we view the image through our filter.
Other portions of the image may be a color that contains SOME of the same wavelength as our filter. In this case we will still be able to see the object. It will be faint because ALL of the light is not transmitted throught the filter.
![]()
 |
|
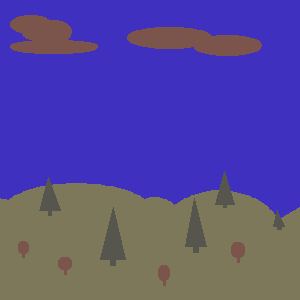
We see here that the blue light from the sky is transmitted most effectivly through the blue filter.
![]()
 |
|
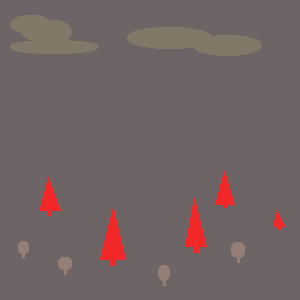
We see that the light from the red trees is transmitted most effectively to our eye through the red filter. If you were a scientist interested in studying the type of tree that is represented in red, you might find it useful to view this image with a red filter. By using the correct filter you can study the features that interest you without being distracted by the other items in the image.
![]()

The use of filters can be very helpful to scientists. When we use the correct filter we can enhance a particular feature and mute the others. Sometimes this makes the feature we are interested in easier to study.
When you observe an object through a filter you must remember that you are not seeing all the information. When you look at the landscape above with a red filter you are lead to believe that there is only one kind of tree on this hillside. When you use a yellow filter you also think there is only one kind of tree, but it is a differet kind. If you want to understand the entire landscape you must remember to include the information you gather from each filtered image.
Now that you understand a little bit about how filters work, let's make a filter wheel and use it to view the Crab Nebula!
![]()
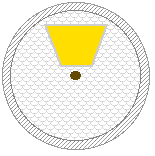
Once you have cut out your first section, place this paper plate on top of the second plate and trace around the inside of the cutout portion onto the other plate. Now rotate your cut plate about 1/3 of the way around and trace out the section again. Rotate the top plate another 1/3 and trace out the section one more time onto the uncut plate. The uncut plate should now have three, equal sections traced onto it. Make sure there is enough space between each section so the plate will hold together once you cut them out. Cut out each of the sections that you just traced onto the plate.
You should now have two paper plates, one with a single section and another with three cut out sections, as shown. Take the plate with three sections and tape a different color of cellophane onto the back of each opening. Make sure to trim your cellophane so that it does not extend over more than one opening.
Punch a small hole through the center of each plate with your pencil
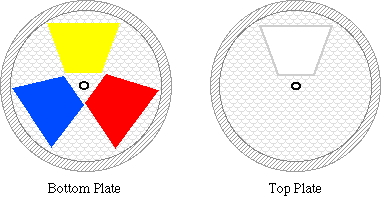
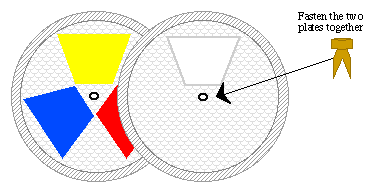
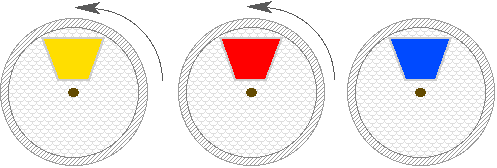
Here is a higher resolution image of
the Crab Nebula to print on your color printer!
The gas is several different colors because it is at different temperatures. The hottest part is blue in color, the coldest is red.
We are going to look at the Crab Nebula through our color filter wheel. Within your team assign one color from the color wheel to each team member. Someone will be blue, someone will be red and the other person will be yellow.
Hold your filter wheel, with your assigned color showing, over the image of the Crab Nebula. Sketch what you see. Do not remove the filter while you are sketching. Try to make your sketch as accurate as you can in color, size and detail. Your partners should do the same thing with their color wheel turned to the color assigned to them.
Once everyone on your team has finished making a sketch of the Crab Nebula compare your sketches with one another. Are they all the same? Are they different? If they are different, discuss the ways in which they differ.
![]()

![]()
Why do you think each person saw a different image depending on which
color filter they used?
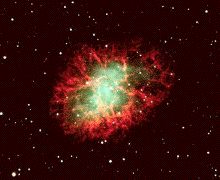
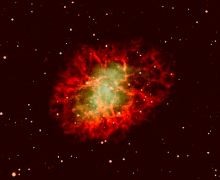
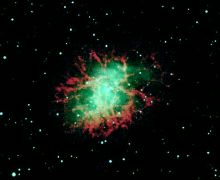
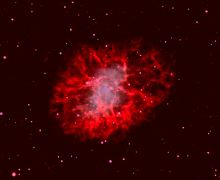
Use the filter table below to investigate further.
 |
|
![]()
 |
|
![]()
 |
|
![]()
 |
|
![]()

The blue filter on your color wheel for instance is a good choice if you are interested in studying the hot, central portion of the Crab nebula. The red filter is a better choice for enhancing the outer gaseous regions. The yellow filter enhances the filament structure in the center of the nebula.
Filters are a very useful tool for scientists. When taking data from an image one must always be careful and remember that things look different if the image has been filtered. The Crab nebula looks very hot and small through the blue filter and very large and cool through the red. Niether of these views alone give an accurate representation, but by combining the information gained with the different views, we can create an accurate discription of the object.
This method of observing through different filters and then collecting the
information into a complete picture is used all time when we look at our
nearest star, the Sun. Let's investigate how solar scientists use filters
to view the Sun.
![]()
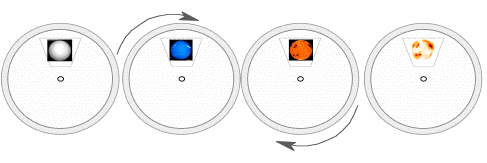
Scientists look at different layers of the Sun by using telescopes with different filters. The filter wheel on board the Yohkoh solar telescope is much like the filter wheel you constructed earlier in this lesson. By rotating one wheel with a window the telescope operators are able to select the type of filter they want to use to view the Sun. These solar filters can sort out many kinds of radiation, not just colored light.
In the image below you can see the filter wheel is located near the back of the soft x-ray telescope on board the Yohkoh satellite.
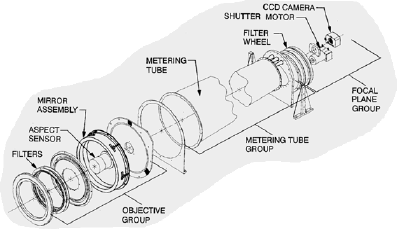
Let's look at the sun as seen through many different filters.
![]()
 |
|
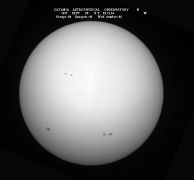
This image has recorded all wavelengths of visible light emitted from the Sun. No single wavelength has been filtered out, but a filter was used to reduce the amount of light. The Sun is very bright. When we look at the Sun we must reduce the brightness so we do not damage our eyes or our camera.
What do you see in this image? Click on it to see a larger version. You should be able to find some dark spots, called sunspots.
![]()
 |
|
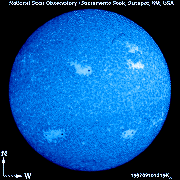
This image allows us to see some of the magnetic structure on the Sun. The bright sections show where the magnetic field is the strongest.
So you see any correlations between this image and the other solar images?
![]()
 |
|
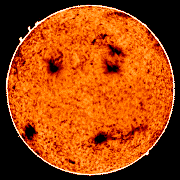
This image was taken through a filter which only allows radiation with a wavelength of 1083 nanometers to pass through. This wavelength corresponds to infrared radiation, or heat. Radiation of this wavelength comes from ionized Helium atoms in the Sun.
Before this radiation leaves the Sun some of it is absorbed by dense gas in the Sun's atmosphere. These dense regions appear dark because there is no radiation of this wavelength left to make it to the camera.
This image provides information about a layer of the Sun above that seen in the Calcium image.
![]()
 |
|
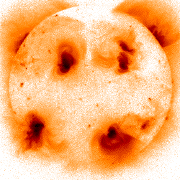
X-rays from the Sun are produced by hot gas of more than one million degrees. This gas exists in the highest layer of the Sun called the corona.
Do you notice any correlation between this image and the other solar images?
![]()
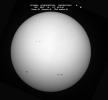
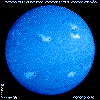
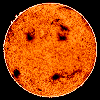
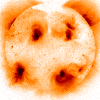
What differences and similarities do you notice between the different images? (If you click on each image you will get a larger version.) You might have noticed that the sunspots in the whitelight image are in approximately the same place on the Sun as the intense magnetic regions in the Calcium image. The dense gaseous regions which appear dark in through the Helium filter also occur in this general area as do the bright active regions in the Xray image. Remember that each image is of a different layer in the sun. Some layers are higher up in the Sun's atmosphere than others.
Here again we see how different filters can be helpful to scientists. In addition to those seen here there are many other filters available for solar scientist to help them study the Sun. If you are interested in studying the magnetic field in the Sun you would want to include a Calcium image and perhaps an X-ray image which shows some magnetic loop structure. If you are interested in the way the density of the atmospheric gas varies around the disk of the Sun you would study a Helium image.
The use of filters allows us to study one or two factors at a time without being distracted by too much information. Later, by considering all the information together we can then paint a representative picture of the Sun or whatever object we happen to be studying.
![]()
|
For questions about this lesson, please contact
Michelle B. Larson |  Selected by the sciLINKS program, a service of National Science Teachers Association. Copyright 1999-2002. |